Meet Cashflow: see the whole shape of your money, month by month
Ledgr v2026.7.1 introduces Cashflow: see every month's earnings, expenses, and investments with a live Net P&L — plus PDF reports and Excel export.

Plus PDF reports, Excel export, and a cleaner app shell — everything new in Ledgr this release.
Most money apps are good at one question: where did my money go last month? That's useful, but it's backward-looking. It tells you the story after it's already written.
The question that actually changes behaviour is a different one: what does a normal month look like for me — and what's left over when it's done?
That's the question Cashflow was built to answer. It's the biggest thing we've shipped, and with this release it graduates from an experiment into a full planning surface. Alongside it we've added shareable PDF reports, Excel export, and a round of polish to the app itself. Here's the full tour, and — more importantly — how to actually use it.
Why we built Cashflow
Expense tracking tells you what happened. Budgets tell you not to overspend a category. Neither one tells you the thing you most want to know: at the end of a typical month, am I ahead or behind, and by how much?
Answering that by hand means juggling your salary, your rent, the three subscriptions you forgot about, the SIP that goes out on the 5th, the quarterly insurance premium, and the freelance income that lands in a different currency. It's a spreadsheet problem, and spreadsheets are exactly the thing you swore off when you installed a finance app.
Cashflow is that spreadsheet, rebuilt as a living view. You describe your money once — what comes in, what goes out, what you set aside — and Ledgr projects it across every month, does the currency maths, rolls it into your net worth, and draws you the trend. You stop guessing at the shape of your month and start seeing it.
The three kinds of money
Everything in Cashflow is one of three things, and getting this mental model right is most of the battle:
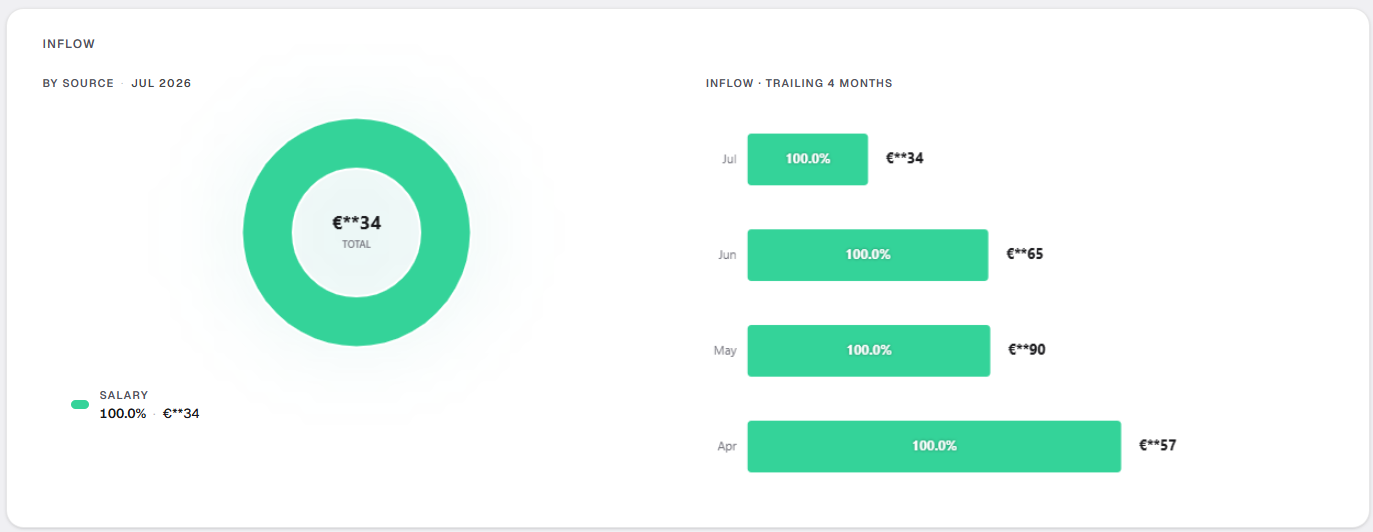
Earnings — money coming in. Salary, freelance invoices, rental income, dividends. Earnings are the only thing that pushes your monthly Net P&L up.
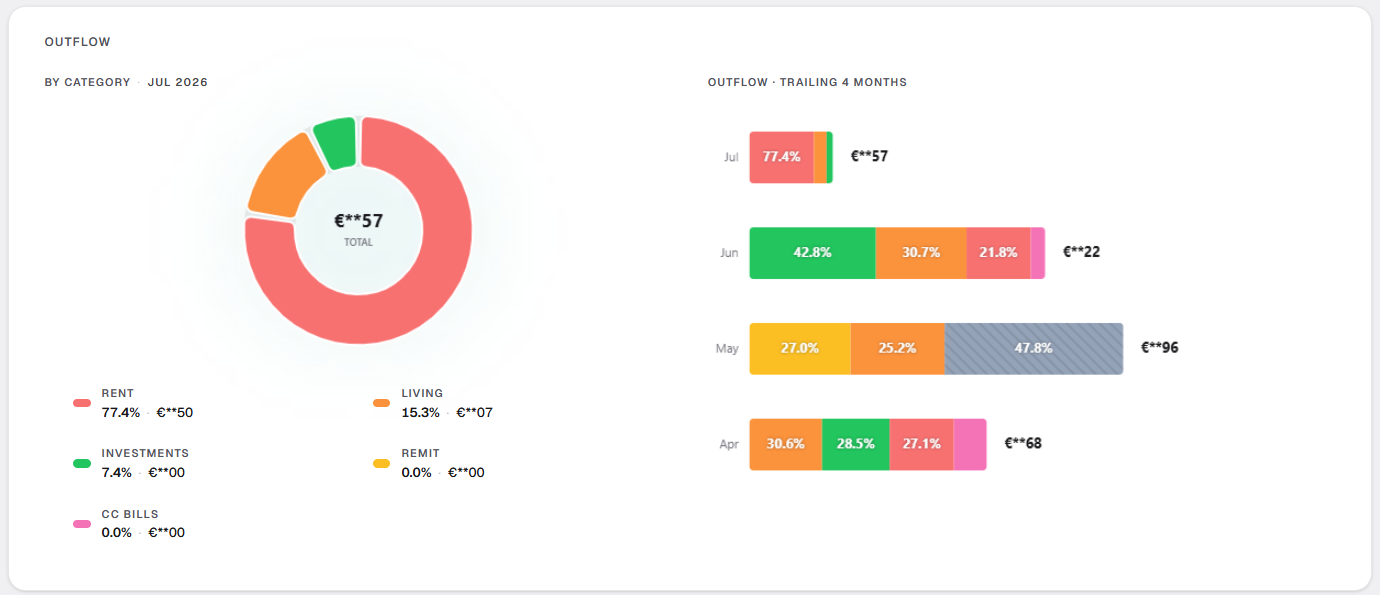
Expenses — money going out. Rent, groceries, that dinner, your subscriptions. Expenses pull Net P&L down.
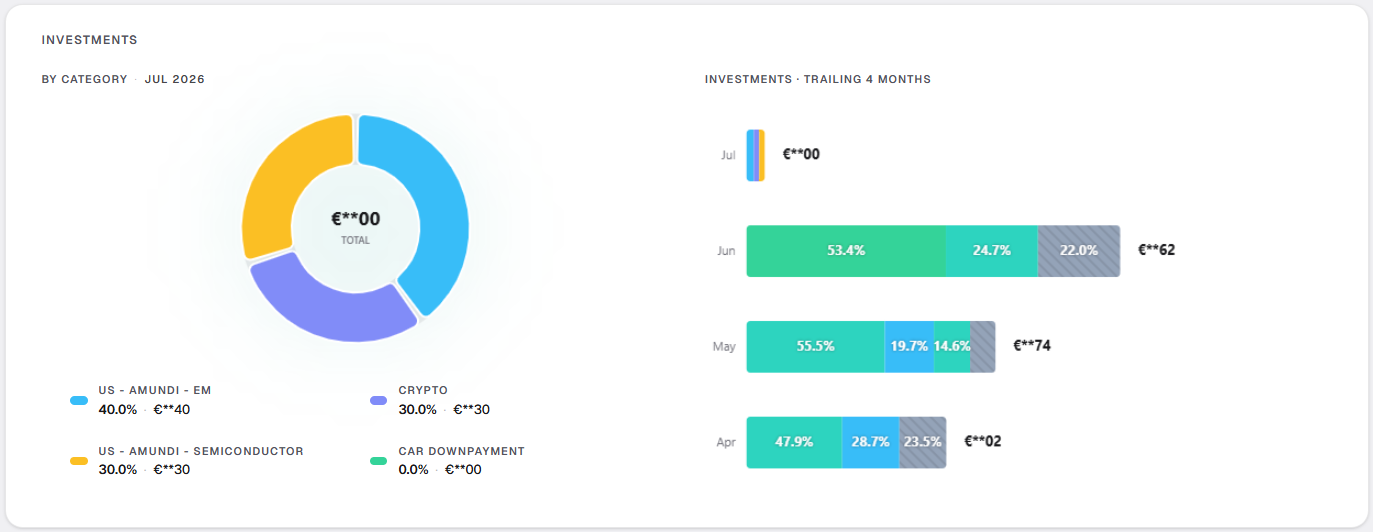
Investments (set-aside) — money you move toward your future self: a SIP, a recurring transfer to savings, a stock purchase. This is the important subtlety — set-aside money is tracked but treated as neutral to your Net P&L. It hasn't left your life, it's changed form. Counting your SIP as a "loss" every month would be misleading, so Ledgr doesn't. You see it, you plan around it, but it doesn't drag down the number that tells you whether the month worked.
That single distinction — expense versus investment — is why Cashflow feels honest in a way a plain in/out ledger doesn't.
Cashflow is meant to track the flow of money. Even if you have multiple sources of income, or just one. Even if your expenses/investments are in multiple currencies. You can track the allocation of money and the outcome it bears. Entries, on the other hand, tells you what is the current value of your instruments – assets or liabilities.
One-off vs. recurring: describe it once
Every line you add is either a one-off or a recurring item.
A one-off is exactly what it sounds like — a wedding gift, a flight, an irregular bonus. You enter it in the month it happens.
Recurring items are where the leverage is. Set an item to recur and you choose a cadence — daily, weekly, bi-weekly, monthly, quarterly, semi-yearly, or yearly — along with a start date. Your ₹40,000 rent shows up every month without you touching it. Your quarterly insurance premium lands in the right three-month rhythm. Your yearly domain renewal appears once a year and stays out of your way the rest of the time.
Recurring items come in two flavours. A fixed-cost item keeps the same amount on every occurrence — perfect for rent, EMIs, or a subscription that never changes. A regular recurring item shows up on schedule but lets you type the real number each month, which is ideal for things like groceries or utilities that hover around a figure without being identical.
The payoff: you set up your financial life once, and the months mostly fill themselves in. Maintenance is typing the occasional actual over a projection.
Reading the grid
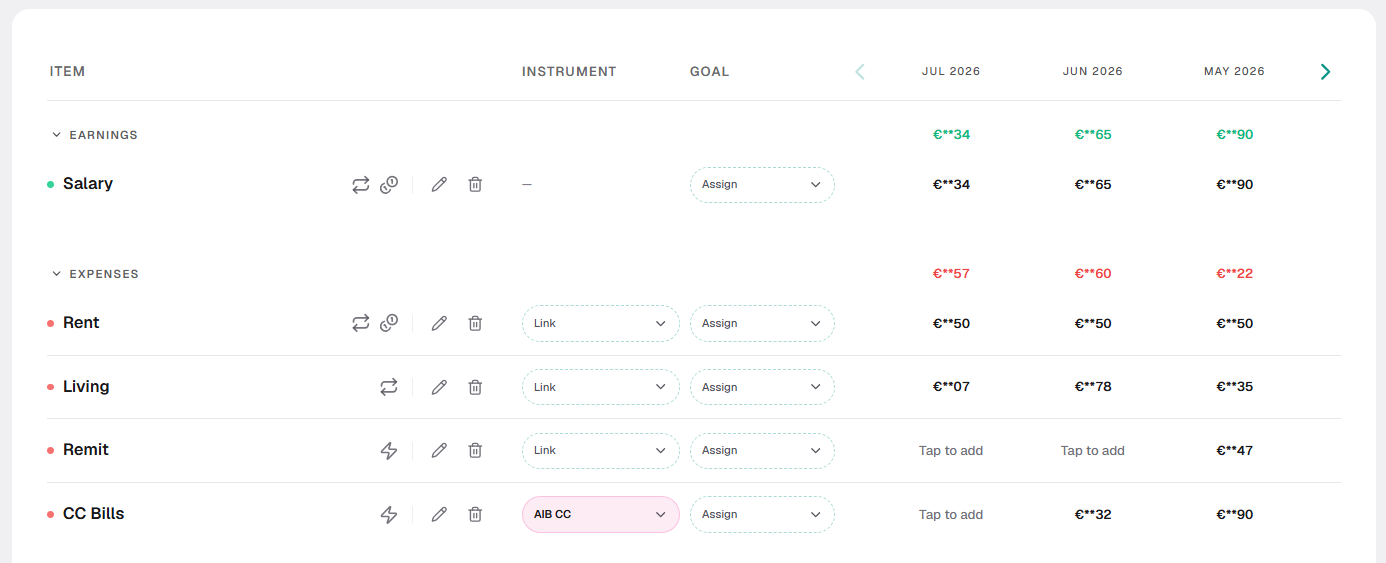
Cashflow presents as a month-by-month table — earnings on top, expenses in the middle, investments below — with your Net P&L totalled at the bottom of each month. On a wide screen you see three months side by side; on mobile it collapses to a single focused month with arrows to step backward and forward (you can page back through nearly two years of history).
The number to watch is that bottom line. Green months build your net worth; red months eat into it. Because recurring items are already projected forward, you're not just seeing the past — you're seeing next month before it happens, which is the whole point. If March is going to be tight because your insurance premium and your annual subscription both land, you find out in February.
Classify expenses to see the why
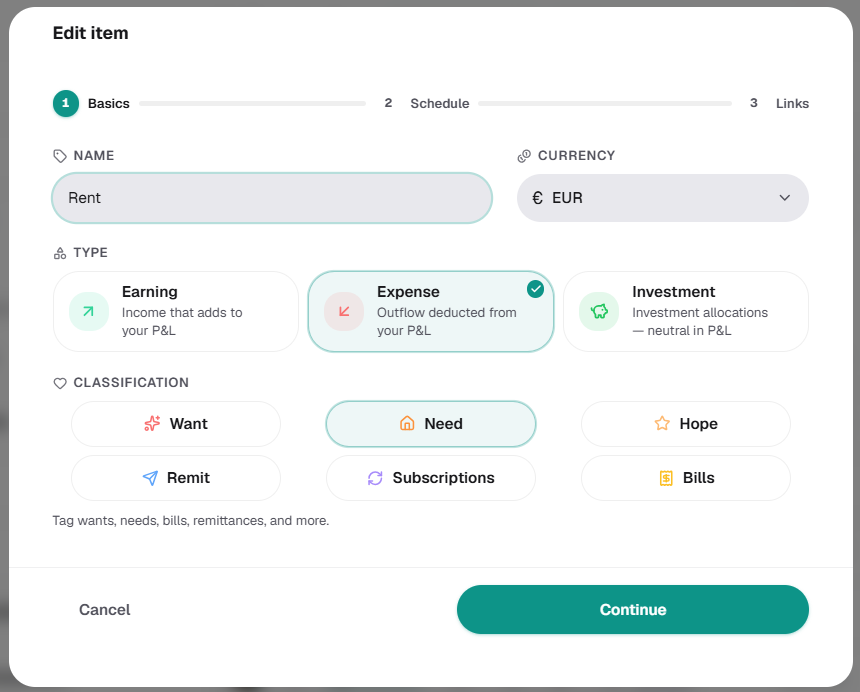
Each expense can carry a classification so you can see not just how much you spend but what kind of spending it is: Need, Want, Hope, Remit, Subscriptions, or Bills. Once your expenses are tagged, the composition charts break your month down by these buckets — and suddenly "I spend too much" becomes the far more actionable "my Wants are creeping up while my Needs stayed flat." Subscriptions get their own bucket on purpose, because they're the spending most likely to quietly outlive their usefulness.
The Net P&L chart
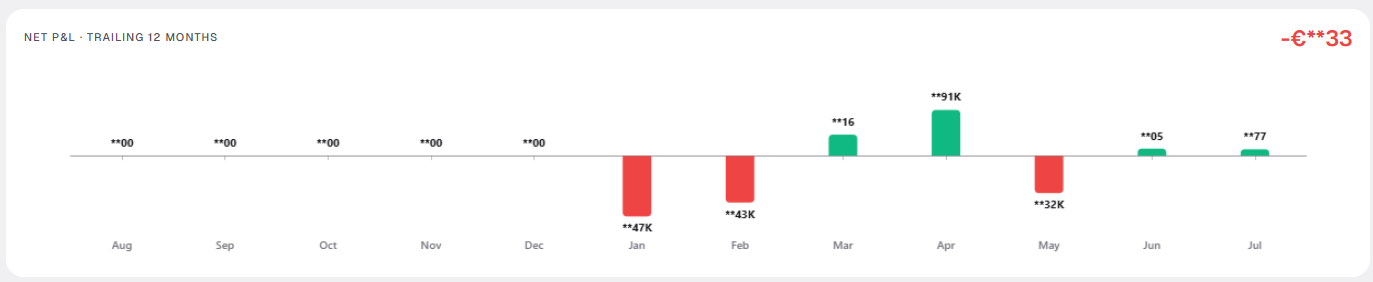
Above the grid sits the Net Cashflow chart — a rolling 12-month view of earnings, expenses, set-aside, and the resulting net. This is the "am I trending the right way?" glance. One tight month is noise; three descending bars is a signal. Seeing them next to each other turns a vague unease into a decision you can act on.
Multi-currency, handled quietly
If you earn in one currency and spend in another — freelancers, remote workers, anyone with money in more than one place — you know how quickly this becomes a headache.
Multi-currency has been one of the core pillars of Ledgr, and it is here stay that way.
In Cashflow, every line item can carry its own currency. A client invoice in USD, rent in INR, a subscription billed in EUR — enter each in its native currency and Ledgr converts everything into your chosen display currency using that month's exchange rates before it totals anything. Your Net P&L is always expressed in one honest number, and you can flip the display currency whenever you want without re-entering a thing.
Linking items to instruments and goals
This is where Cashflow stops being a standalone table and becomes part of the rest of Ledgr.
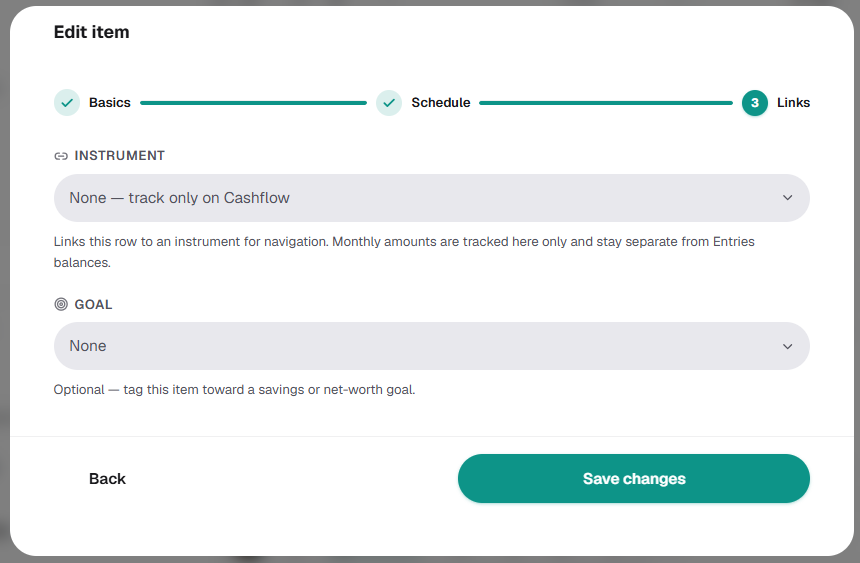
Instrument links. A recurring item can be linked to an instrument — one of the assets or liabilities you already track. Link your monthly SIP to your mutual-fund holding, or your EMI to your loan, and the monthly values flow through to that instrument instead of living in isolation. Your plan and your actual balances stop being two separate stories.
Goal links. Any earning, expense, or investment line can be tagged to a goal. Setting aside ₹15,000 a month toward a house down payment? Link that item to the goal and every month's contribution counts automatically. The goal fills up as your real behaviour happens, not as you remember to update a tracker.
New this release: reports, and getting your data in and out
Cashflow is the headline, but v2026.7.1 shipped three more things worth knowing about.
PDF reports you can actually send
You can now generate a branded PDF report for a given month straight from Ledgr. It pulls together your net-worth snapshot and its month-over-month change, a six-month net-worth trend, your recent cashflow months, a category breakdown, and progress on your goals — laid out cleanly enough to hand to an accountant, a partner, or your own future self at tax time. It's the one-page answer to "how are things going?" without giving anyone access to your live data.
CSV & Excel export — your data is yours
And it goes the other way too. Export your cashflow and entries to CSV or a formatted Excel workbook any time. This matters to us on principle: Ledgr is privacy-first, and part of that promise is that your data is never locked in. You can pull it out whenever you like, in a format you can open anywhere.
We also spent time on the app itself this cycle — a cleaner navigation shell, avatars, theme and motion preferences (including reduced-motion support), and a refreshed pricing page — so the whole thing feels a little more finished.
A five-minute setup that pays off for months
If you're starting today, here's the fastest path to a Cashflow view that's genuinely useful:
First, add your earnings — start with salary, then any other reliable income. Set the recurring ones to monthly. Next, add your fixed expenses as fixed-cost recurring items: rent, EMIs, insurance (quarterly or yearly), the subscriptions you're sure about. Then add your variable expenses as regular recurring items — groceries, dining, transport — and just type this month's rough number; you'll refine it as you go. Add your investments as set-aside items and link them to the relevant instruments or goals. Finally, if you want your surplus to compound visibly, point your Net P&L at your main savings account.
Five minutes of setup, and you've got a projection of every month ahead — and a Net P&L number that finally tells you the truth about how your money moves.
Cashflow is available to Ledgr Pro (and anyone on a free Pro trial). If you've been meaning to see the whole shape of your money instead of just last month's damage, this is the release to try.
Building something you wish existed? Cashflow started as one of our own frustrations. If there's a view of your money you keep wishing you had, tell us — we read every response.